my mississippi mills informal residents’ survey final results
![]()
Of all the comments on my Mississippi Mills Informal Residents’ Survey (which I first talked about on The Millstone here), this is one of my favourites:
“It has been my experience that a community is only as strong as the commitment of the people who live in it,” one respondent wrote in the Q 8 comment field in on my Mississippi Mills residents’ survey.
“When I see myself as part of a community, it affects how I work with others,” he or she elaborated. “I tend to notice my neighbours and their needs. I reach out to a friend, even when I would rather watch TV. I participate in a committee because it is for not just me but my neighbour, my community.”
The 260 people who responded to the survey, which I conducted independently in October to satisfy my own curiosity, left a total of 218 comments on the five survey questions that included comment fields. The majority of the comments are positive, constructive and/or hopeful in some way. The minority, not so much. That’s normal. We are diverse. Our experiences, thoughts and opinions are also diverse.
I administered the survey online using Survey Monkey with links via the Friends of Mississippi Mills Facebook page and the article in The Millstone.
Here are the results in full (PDFs of the comments may be read at the links after each of the pie charts):
Q 2: Ninety-one (91) per cent of the respondents agreed or strongly agreed with the statement “I love living in Mississippi Mills.” One of the 260 respondents skipped this question.
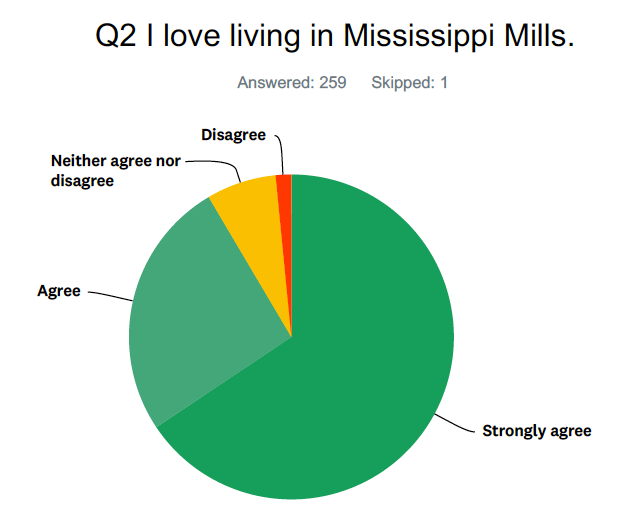

Thirty-seven respondents left comments on Q 2; I subjectively classified them as positive, negative and neutral; some comments were both positive and negative. The comments are here.
Q 3: Eighty-four (84) per cent of the respondents agreed or strongly agreed with the statement “I think Mississippi Mills can be made to be a better place to live.” About 13 per cent neither agreed nor disagreed.
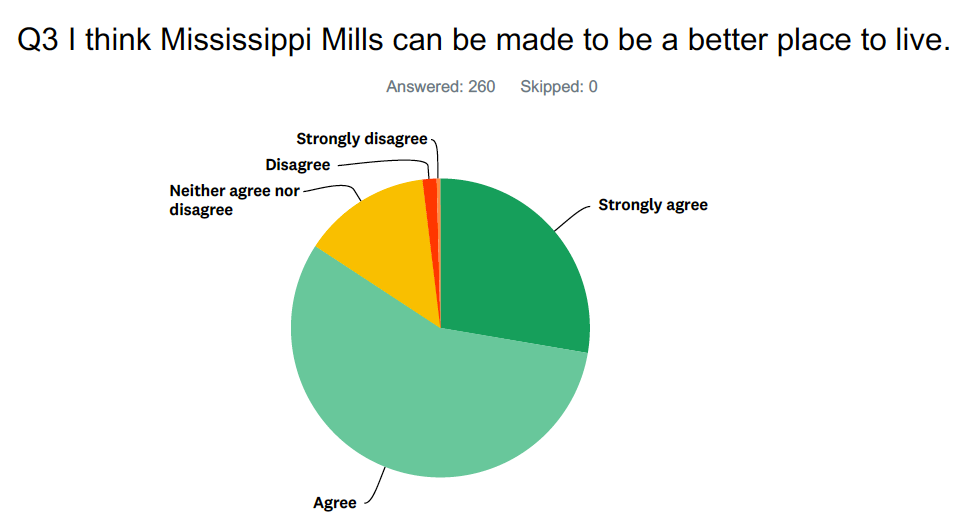

There were forty-seven (47) comments in total of which twenty-three (23) were versions of “There’s always room for improvement.” The other twenty-four (24) comments on Q 3 are here.
Q 4: Ninety-six (96) per cent of the respondents agreed or strongly agreed with the statement “I believe the MM Municipal Council and MM residents should work together to make MM a better place to live.”
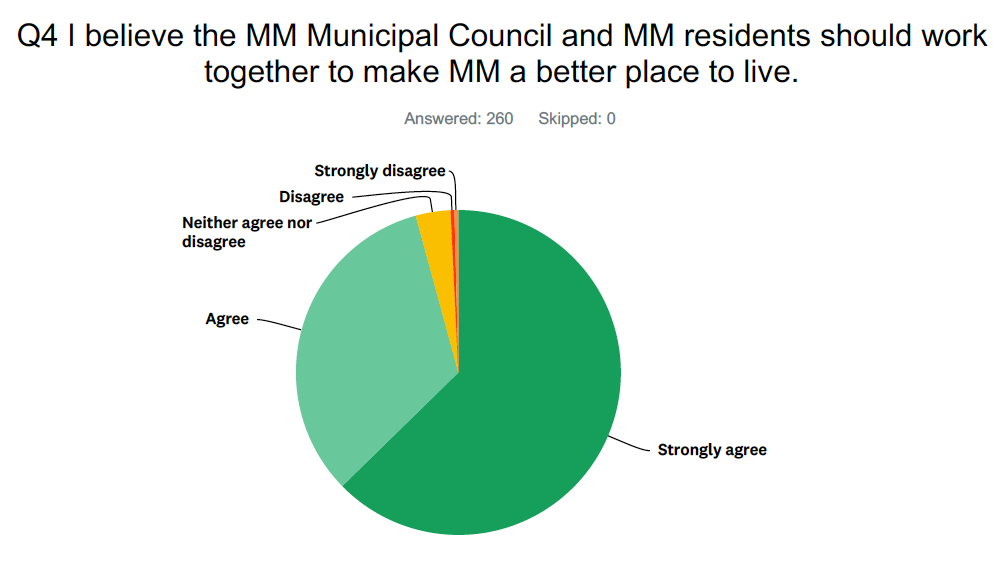

There were thirty (30) comments in total in reference to Q 4 above. The comments are here.
Q 8: The largest number of comments were generated by Q 8, which asked respondents if they wished to “add anything.”
One hundred and one (101) respondents commented on Q 8; eleven (11) of those said a version of “No, nothing more to add.” I have removed those eleven comments from the list, and reproduced the other ninety comments in a PDF which may be read here.
The full results (not including the comments), may be viewed as a PDF here.
Demographics:
I asked three demographic questions:
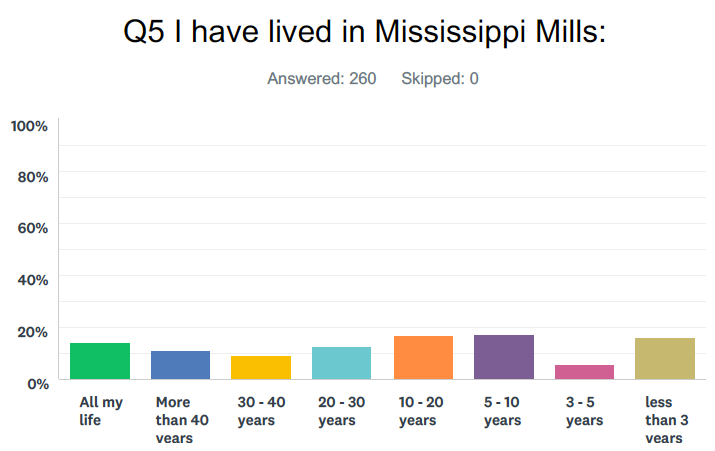
- length of time living in Mississippi Mills (Q 5)
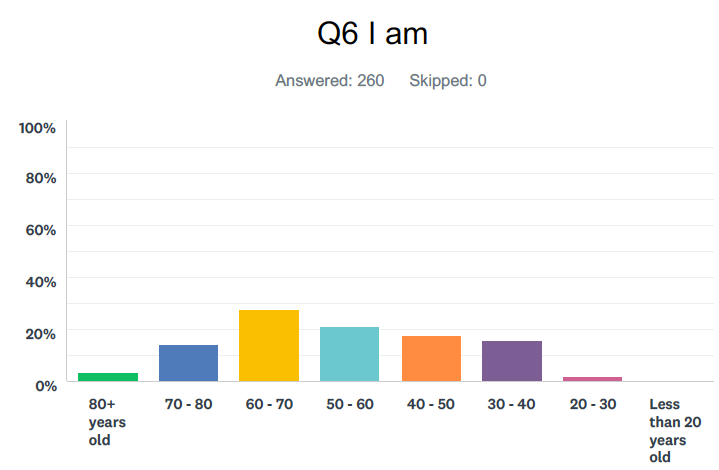
- age (Q 6)
- gender identification (Q 7).
Respondents have lived in the municipality for varying lengths of time. Thirty-one (31) per cent have lived in Mississippi Mills more than 20 years, and about 14 per cent said they have lived here all of their life, regardless of their age. Interestingly, like me, almost 16 per cent of the respondents have lived in Mississippi Mills less than three years; that’s only about two per cent more than have lived here their whole life.

The bar chart of the age range of respondents is somewhat “bell shaped,” “skinny” on either end and “fat” in the middle. Of the 260 respondents, eight were over 80 years old, and half that many were between 20 and 30. The largest number, almost 28 per cent, were aged 60 to 70 years old.

Finally, with respect to demographics, female respondents outnumbered male respondents by more than two to one.
https://amazingsusan.com/2018/03/18/grist-for-the-mill/
note to self: do not argue with people whose purpose is to argue